
Graphs Tab (Portfolio)
Click image to expand or minimize.
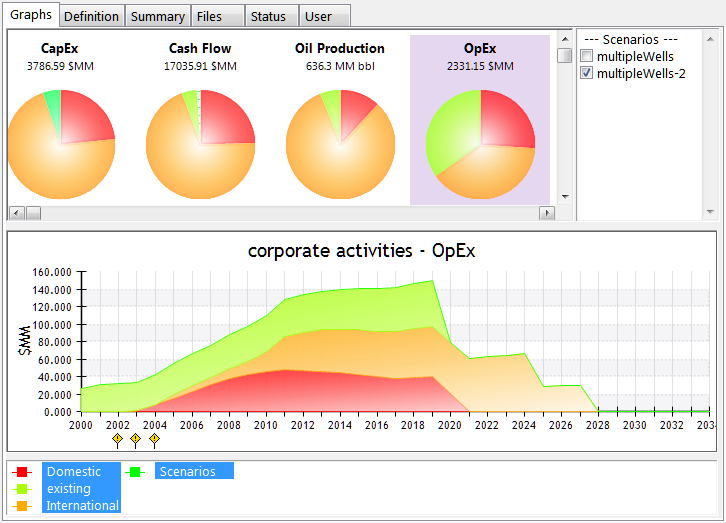
The Graphs tab available when a portfolio is selected displays the portfolio indicators in a series of pie charts and a stacked graph. The pie charts show the cumulative value of each indicator; click on each pie chart to display the progress of each value in the stacked graph. See further under Simulation Graphs.
When the current portfolio includes one or more projects with Scenarios or Contracts results, a pane on the right allows you to select which scenario and/or partner within each project is to be displayed in the rollup.
This tab also shows a summary of those  notifications, defined at the portfolio level or in any of its components, that were issued during calculation of the portfolio.